 The upcoming general election is getting into all our minds, as if politics affects everyone’s life. A few weeks ago I was considering how politicians declare certain identities so that certain communities will vote for them, but once elected as MPs do they declare those identities in the House of Commons, amongst their peers? It struck me that everything said and debated is recorded, it’s called the Hansard Report. Even better is that mySociety make it available to search on the “They Work For You” website which even has an API so programming can be done to dynamically access the information.
So I wrote a little script to search the Hansard Report for “I am”, I plucked out the words that follow until a punctuation mark is encounter or a cut word such as “to”, “would”, “on” etc. and display the words plucked out. My script keeps track of who said the word and the title of the debate(topic) it was said during but it’s a little bit of fun to look at these without worrying about context. As per my original intention I found MPs describing themselves as “from a coal mining family” and “a catholic”.
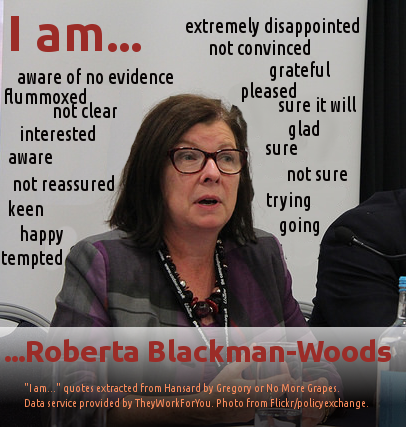
 As a demonstration I manually took a selection of those phrases said by my own MP, Roberta Blackman-Woods, and displayed them on a picture of her, then I did the same for a neighbouring MP, Grahame Mark Morris of Easington. This need input from someone who understands the House of Commons language as a few words including “grateful” and “pleased” are said so much they are probably linguist devices carrying a specific meaning.
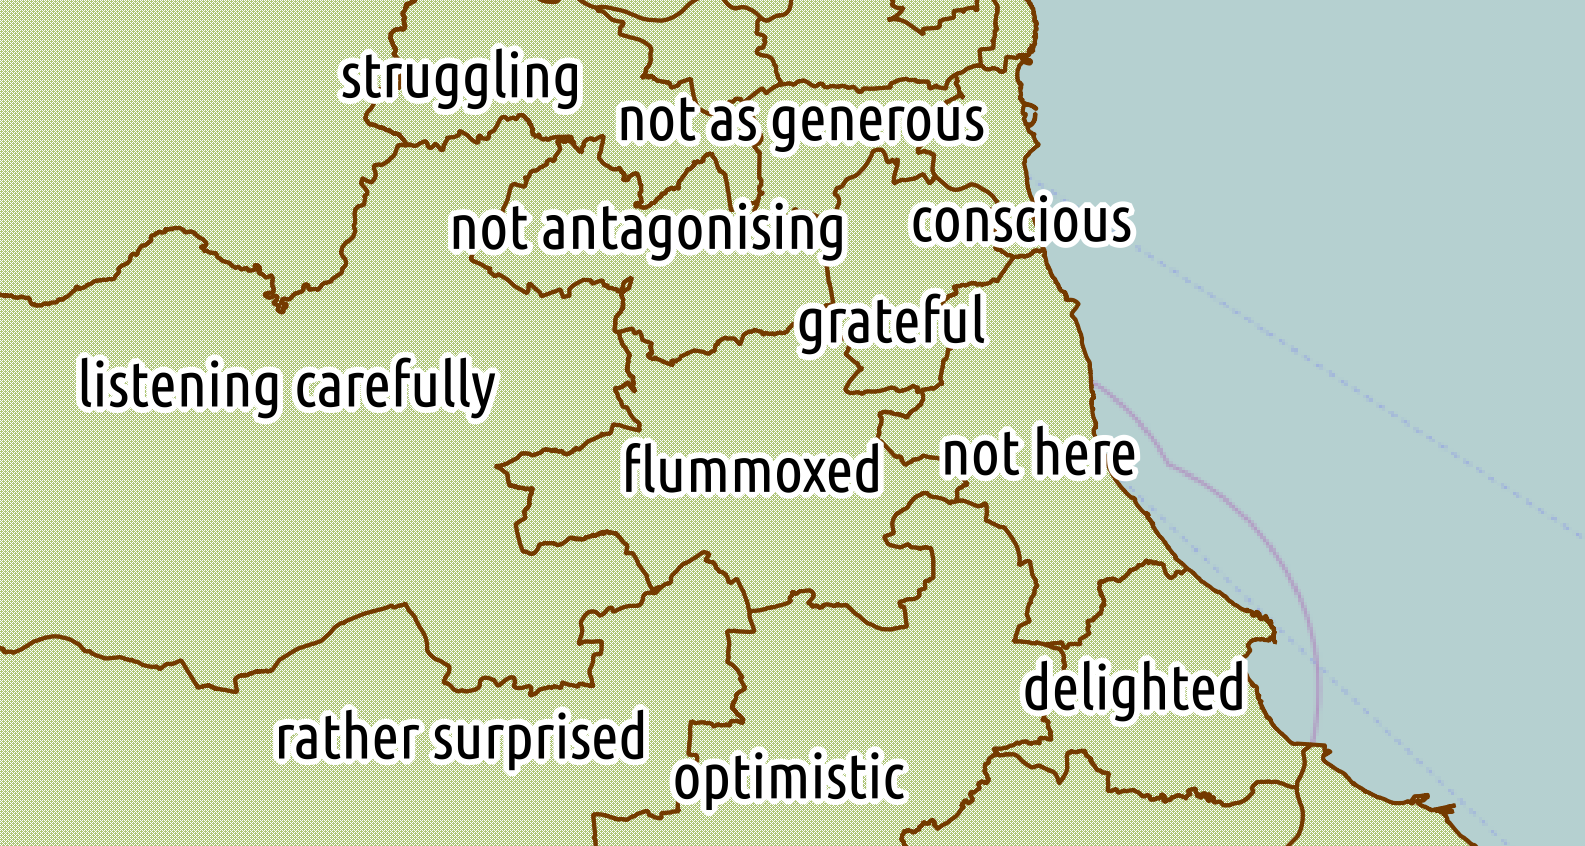 For one last action with this data, I picked out an interesting word/phrase for each MP of a North East constituency and plotted them on a map. With the API available I could develop this further so that it generates the photos automatically for your own MP and lets you see the context of the phrase if you want to. The map could also be automatically generated so that it randomly picks one of the phrases and perhaps changes them each day.
A week after seeing what MPs say they are, the news was covering the increased popularity of UKIP and the Green Party. Everyone wonders what the country would be like if one of those parties ran the country, and not in a coalition like the Lib Dems are because that gives a reason for not all their policies to be implemented. I was wondering if it’s actually possible for the political party to get a majority of seats(MPs) in the House of Commons. I thought this would be too much work, but this year a crowd-sourced website YourNextMP has been started, and it has an API and CSV export for analysisng the data.
 I downloaded the CSV and added some formulas to count the candidates per party and what percentage of parliament the party would have if all their candidates got elected. For example, if all 611 Labour candidates got elected then they would have 94% of the seats, which is a majority. I don’t want to bring speculation into this, although I know some of those candidates are probably very unlikely to get elected and others are very likely to get elected. The point is that if all their candidates add up to 50% (or 325 in number) there is no way they can run parliament without going into coalition with one or more other parties. The parties that can win on their own, and the number of the candidates, are…
- Labour, 611 candidates = 94% or parliament
- Conservatives, 589 (90%)
- Liberal Democrats, 459 (70%)
- Green Party, 425 (65%)
- UK Independence Party (UKIP), 478 (74%)
It’s worth noting that the Green Party would likely form a coalition with the Scottish Green Party (who could bring 26 candidates, an additional 4%). If all the independent candidates formed a coalition, that would be 55 candidates (only 8%). The BNP only have one candidate which would equate to 0.154%, a long way of winning a majority. I downloaded the candidate data on the 19th February and candidates were still being announced along with volunteers researching the information, more candidates may exist now. If anyone has a list of candidates and parties from the 2010 election I could do a comparison, did UKIP have a chance of a majority parliament then and how much has their attempt at representation grown in five years?
I’m not an expert on politics but the elections do affect every part of my life whether I notice it or not. There is reason for all citizens to be interested in the data that I’ve tried to present and for the meanings to be communicated in fresh and clear ways. If anyone wants to work with me on doing that, get in touch and lets have a chat.
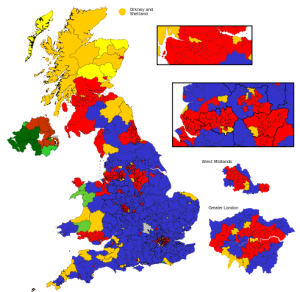
2010 UK Election Map image by Wereon – Own work. Licensed under Public Domain via Wikimedia Commons